
Working with a lab
Click a lab on the dashboard to open the lab view: the live topology of the lab, with everything you need to work with its nodes.
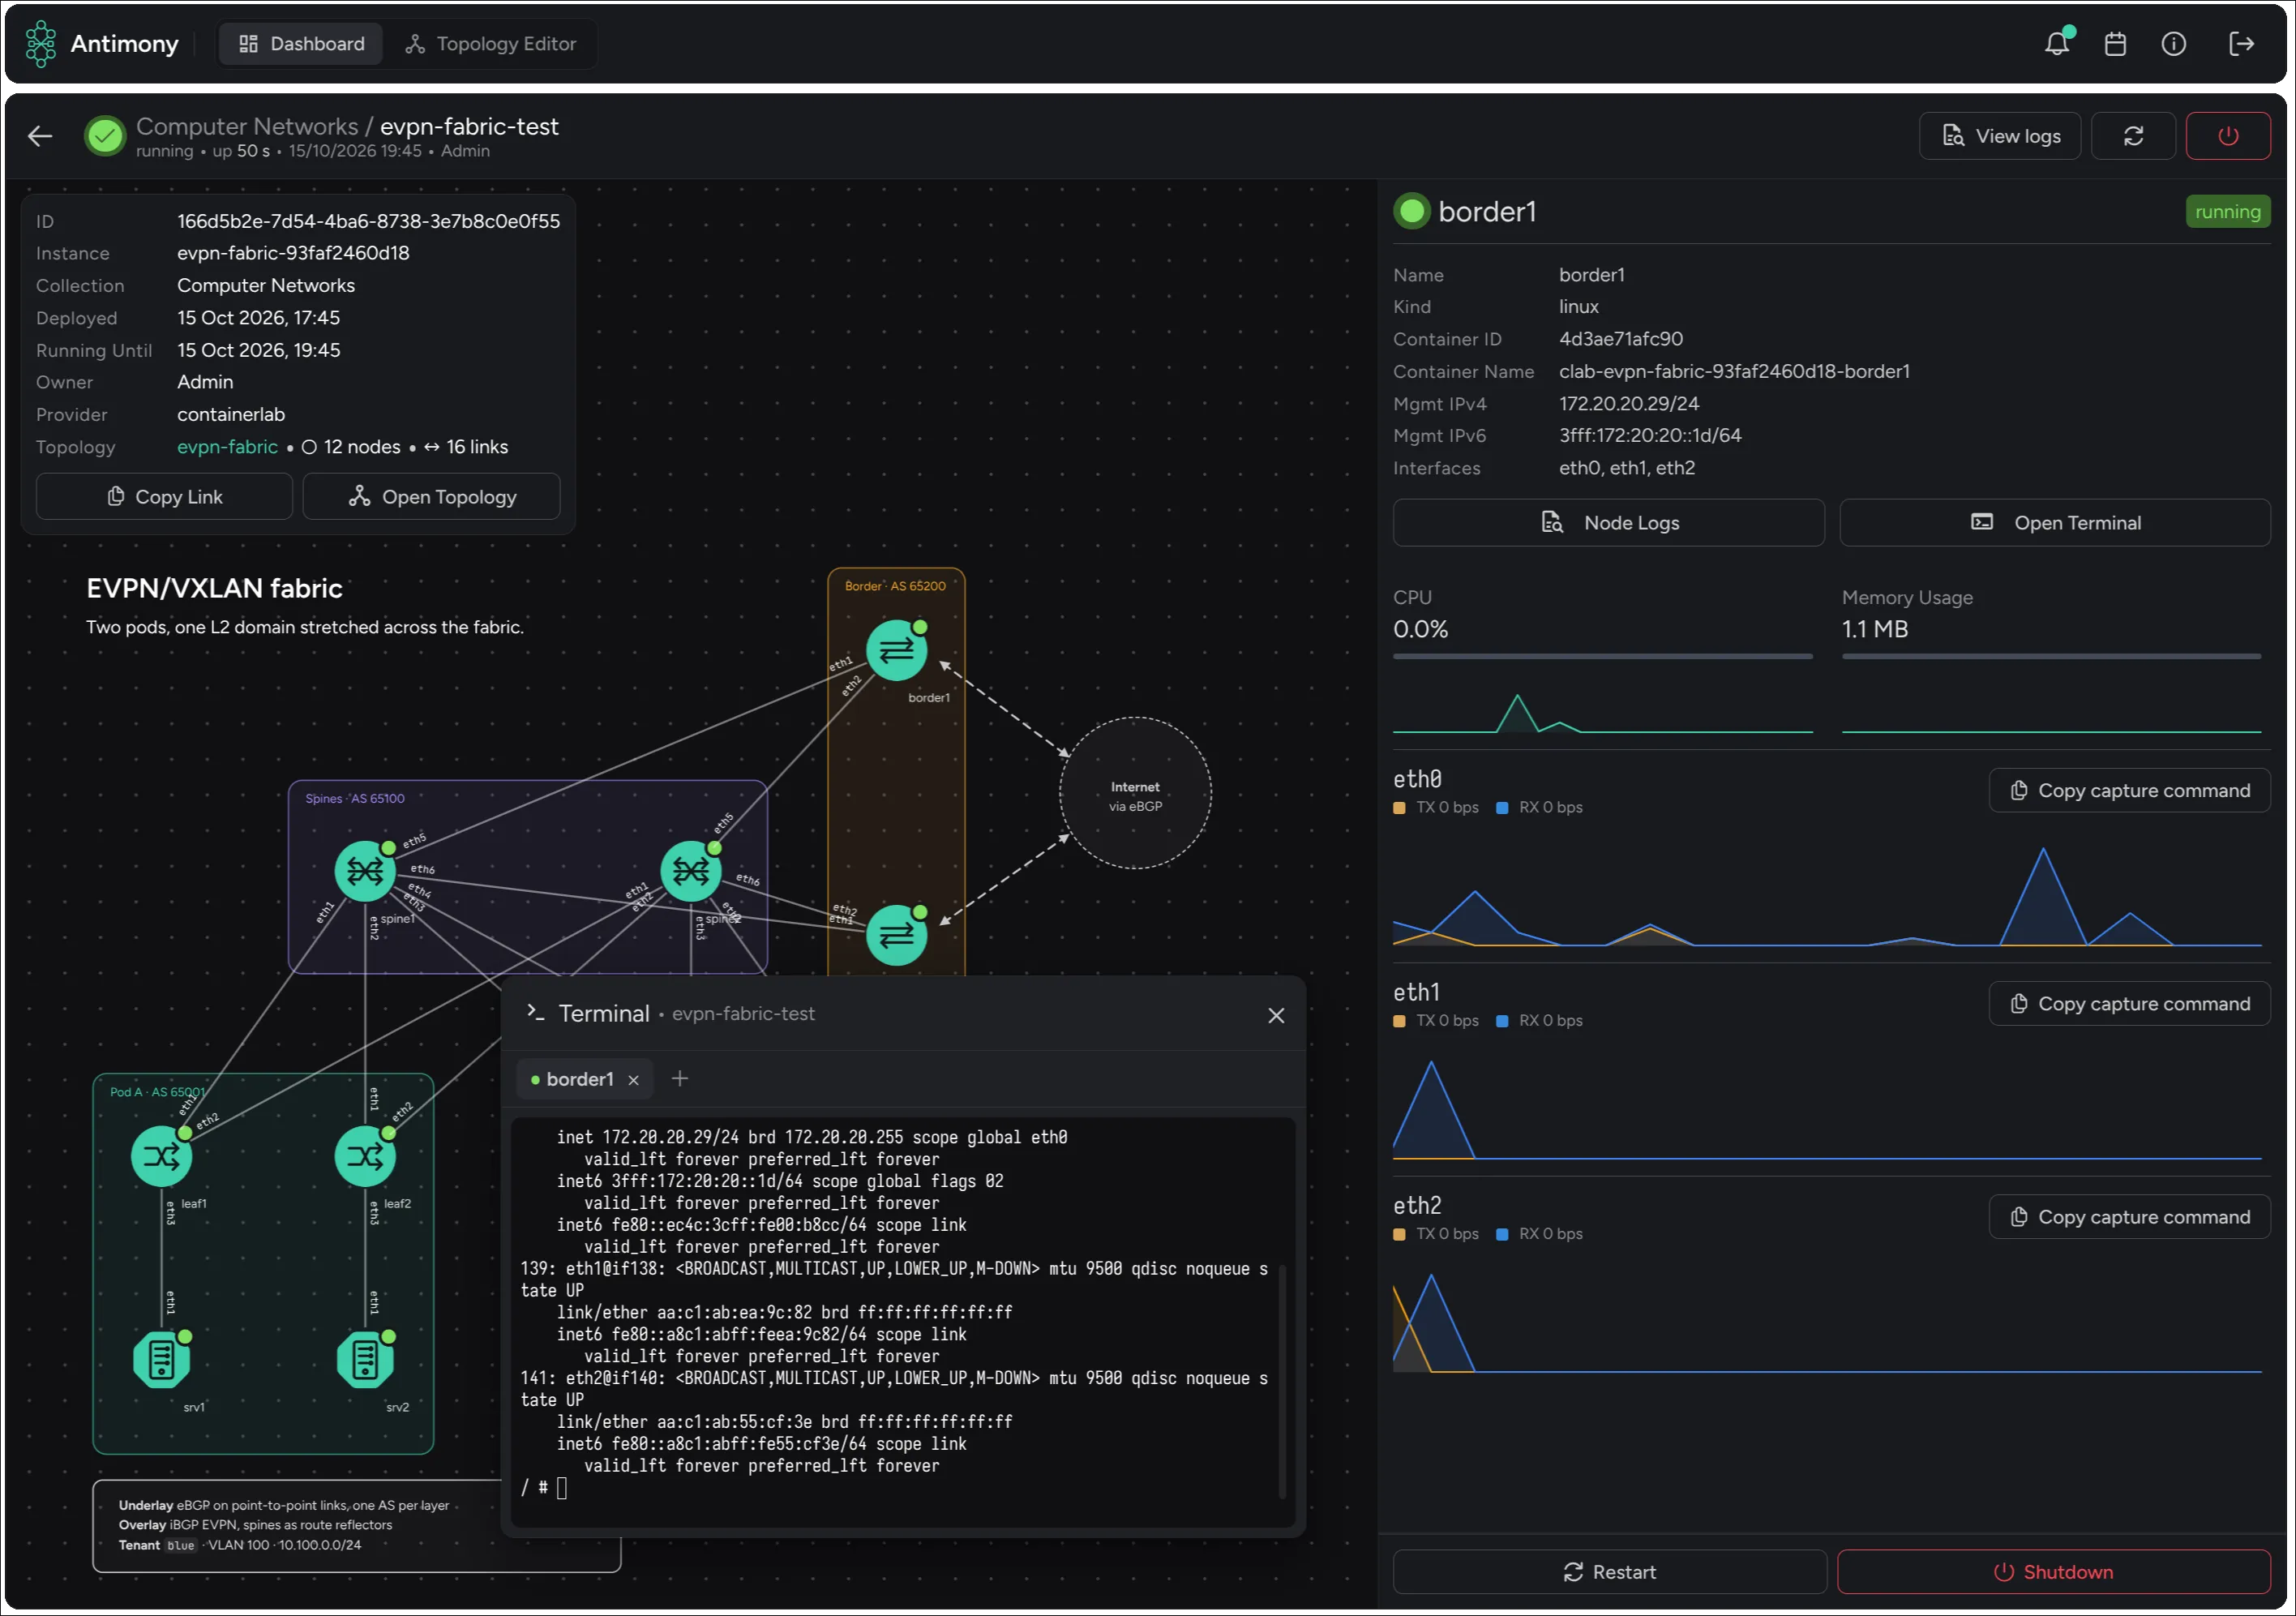
The header
Section titled “The header”The header shows the collection and lab name, the state, how long the lab has been running, when it ends (or “indefinitely”) and who created it.
| Button | What it does |
|---|---|
| View logs | Opens the logs window. |
| Deploy (play) | Deploys a scheduled or inactive lab now. |
| Redeploy (arrows) | Deploys a running lab again. |
| Destroy (power) | Removes the nodes of a running or deploying lab. Asks for confirmation. |
Only the lab’s creator and administrators can deploy, redeploy and destroy the lab, and start, stop and restart its nodes. The other buttons and menu entries are available to everyone with access to the lab.
Lab details
Section titled “Lab details”The panel in the top left lists the lab’s details:
- ID: the lab’s unique ID. Click it to copy it.
- Instance: the instance name the provider uses for the lab.
- Collection, Owner and Provider.
- Deployed and Running until. “(Recovered)” means the server was restarted while the lab was running and has reattached to it.
- Topology: the topology the lab was created from, with its number of nodes and links.
Copy link copies a direct link to this lab; it isn’t shown in Antimony Desktop. Open topology opens the topology in the editor.
To connect to a node through the SSH server, you normally use <collection-name>/<lab-name>/<node-name> as username. The ID and instance name are alternatives for the first part.
The graph
Section titled “The graph”The graph shows the lab’s nodes and links. A dot on each node shows its state; nodes that are starting or stopping pulse, and stopped nodes are greyed out.
- Click a node to open the node panel.
- Right-click a node for Start node, Stop node, Restart node, Open terminal, Show logs, Copy SSH command and Copy capture for <interface>. The capture entries are left out when the server has traffic capture or the SSH server turned off.
- Right-click the background to deploy, redeploy or destroy the lab, view logs or fit the graph to the window.
The node panel
Section titled “The node panel”The node panel shows the node’s name, kind, container ID and name, management IPv4 and IPv6 addresses, and interfaces. While the node is starting, values show “Pending”.
| Button | What it does |
|---|---|
| Node logs | Opens the logs window with this node’s container log. |
| Open terminal | Opens a terminal on the node. Available once the node is ready. |
| Restart / Start / Shutdown | Restarts, starts or stops the node. Some nodes, such as bridges, can’t be (see Node lifecycle); for those you get a message saying so. |
Statistics
Section titled “Statistics”Once the node is ready, the panel shows live CPU and Memory usage charts of the last 20 seconds.
Interfaces and capture
Section titled “Interfaces and capture”Below the statistics, each interface has a chart of its transmitted (TX) and received (RX) traffic.
Copy capture command copies a command that streams the interface’s traffic into Wireshark on your machine:
ssh -p 6969 -l <collection-name>/<lab-name>/<node-name> antimony -- eth1 | wireshark -k -i -The username is put in quotes if a name contains spaces.
Run it in a terminal on a machine with Wireshark installed. See SSH server and packet capture for how it works and what else you can do with it.
Some interfaces, such as lo and management interfaces, are hidden. The list is set by capture.excludedInterfaces in the configuration.
Terminals
Section titled “Terminals”Open terminal opens a terminal window on the node. Antimony logs in to the node over SSH with the credentials from kinds.conf.yml, or opens a shell inside the container if that isn’t possible.
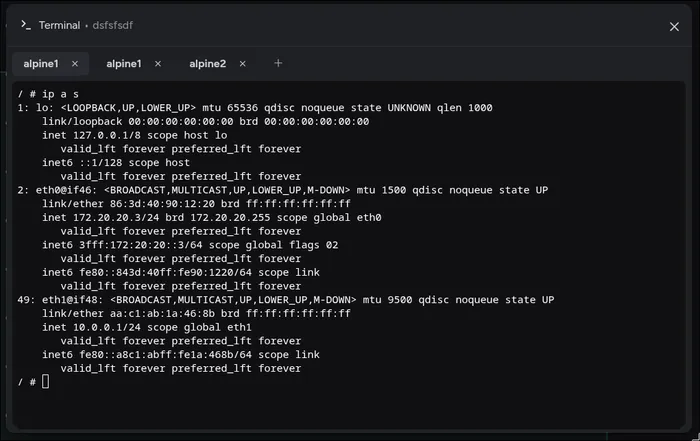
- The window can be moved and resized, and stays open while you work with the graph.
- Each terminal is a tab. + opens a terminal on another node of the lab.
- Closing a tab closes the terminal.
- Terminals keep running when you close the window. Reopening it shows them again with their recent output.
- A terminal that has been idle for 30 minutes is closed and marked as expired.
- You can have up to 20 terminals open at the same time.
- Terminals are private. Only you see the terminals you opened; other users, administrators too, can’t join them.
The idle timeout and the limit are set by shell.timeout and shell.userLimit in the configuration.
View logs opens the logs window. Choose the source in the dropdown:
- Antimony: the lab’s deployment log, with the output of containerlab or clabernetes and Antimony’s own messages
- a node: that node’s container log
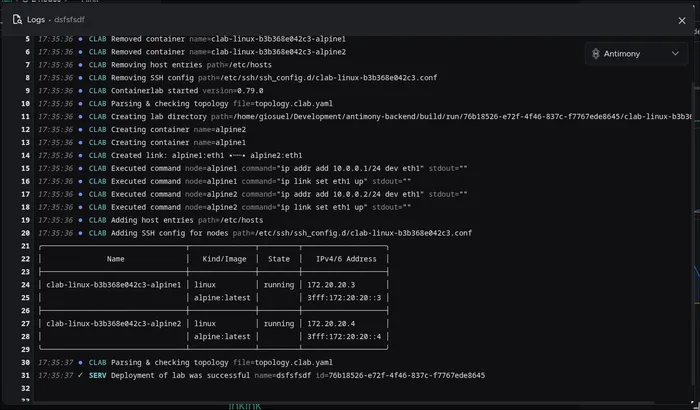
Logs are streamed live. The window shows the most recent 1 000 lines from before you opened it.